A Container Network Interface, or CNI, is an essential part of a functioning kubernetes cluster. A popular one is Weave. Weave exports metrics which you can stream right to your monitoring system, so in this post I will cover the steps I took to monitor my weave CNI DaemonSet using Prometheus operator and Grafana. (With a heavy use of the holy bible of prometheus operator users which helps you debug your configurations until you get them right.)
Prerequisite:
- Weave CNI:
You can check weather you are running weave or not if you type kubectl get pods -n kube-system. If weave is your CNI, you will see a bunch of weave pods, one for each of your cluster nodes.
- Prometheus Operator:
Mine is deployed via helm3, like this -
helm3 install stable/prometheus-operator \
--namespace monitoring --generate-name
make sure you have it by checking weather any prometheus operator pods are running around, usually in the monitoring namespace:
~ $  kubectl get po -n monitoring
NAME                                  READY   STATUS                       RESTARTS   AGE
alertmanager-main-0                   2/2     Running                      0          23d
grafana-98cb6f7c5-c8g8t               1/1     Running                      0          23d
kube-state-metrics-5654498cf6-f7njl   3/3     Running                      18         23d
node-exporter-f4jsd                   2/2     Running                      8          23d
node-exporter-ph4sf                   2/2     Running                      0          23d
node-exporter-qh2b8                   2/2     Running                      12         23d
node-exporter-w6ml7                   2/2     Running                      8          23d
prometheus-adapter-6767fb75b6-j9xkf   0/1     Running                      0          23d
prometheus-k8s-0                      3/3     Running                      19         23d
prometheus-operator-556f8f49d-7zljj   1/1     Running                      0          23d
smtp-server-5c4d895c6-jlflv           0/1     Running                      0          23d
1. Creating weave metrics service:
I want to collect my CNI metrics. By default, weave pods are exposing metrics at 0.0.0.0:6782/metrics, therefore I will create a matching service:
apiVersion: v1
kind: Service
metadata:
  labels:
    app: weave-monitoring
  name: weave-monitoring
  namespace: kube-system
spec:
  ports:
  - name: http-metrics
    port: 6782
    protocol: TCP
    targetPort: 6782
  selector:
    name: weave-net
  type: ClusterIP
2. Creating weave ServiceMonitor:
Once I have a Service, I can create a ServiceMonitor, to let prometheus know about my new metrics endpoint:
apiVersion: monitoring.coreos.com/v1
kind: ServiceMonitor
metadata:
  name: weave-monitoring
  namespace: monitoring
  labels:
    release: monitoring
spec:
  endpoints:
  - path: /metrics
    port: http-metrics
    interval: 10s
  namespaceSelector:
    matchNames:
      - kube-system
  selector:
    matchLabels:
      app: weave-monitoring
this part can be tricky, depending on your prometheus-operator configurations. For instance, sometimes your ServiceMonitor will have to carry certain labels so the operator will be able to recognize it. (Check weather the operator’s
prometheusSpec.serviceMonitorSelectorcontains any labels)
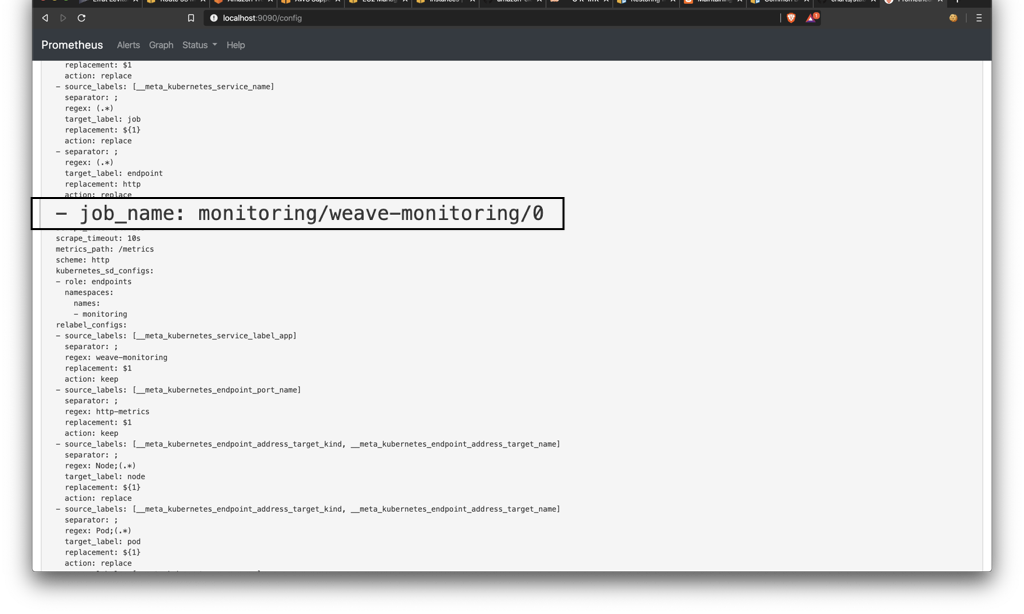
3. Checking prometheus config:
go to your-prometheus-endpoint:9090/config and search for weave-monitoring section:
for example I kubectl port-forward -n monitoring prometheus-k8s-0 9090:9090 and then I go to http://localhost:9090/config and I see:
Now you can query prometheus for weave metrics:
For instance you can try sum(weave_connections) by (state):
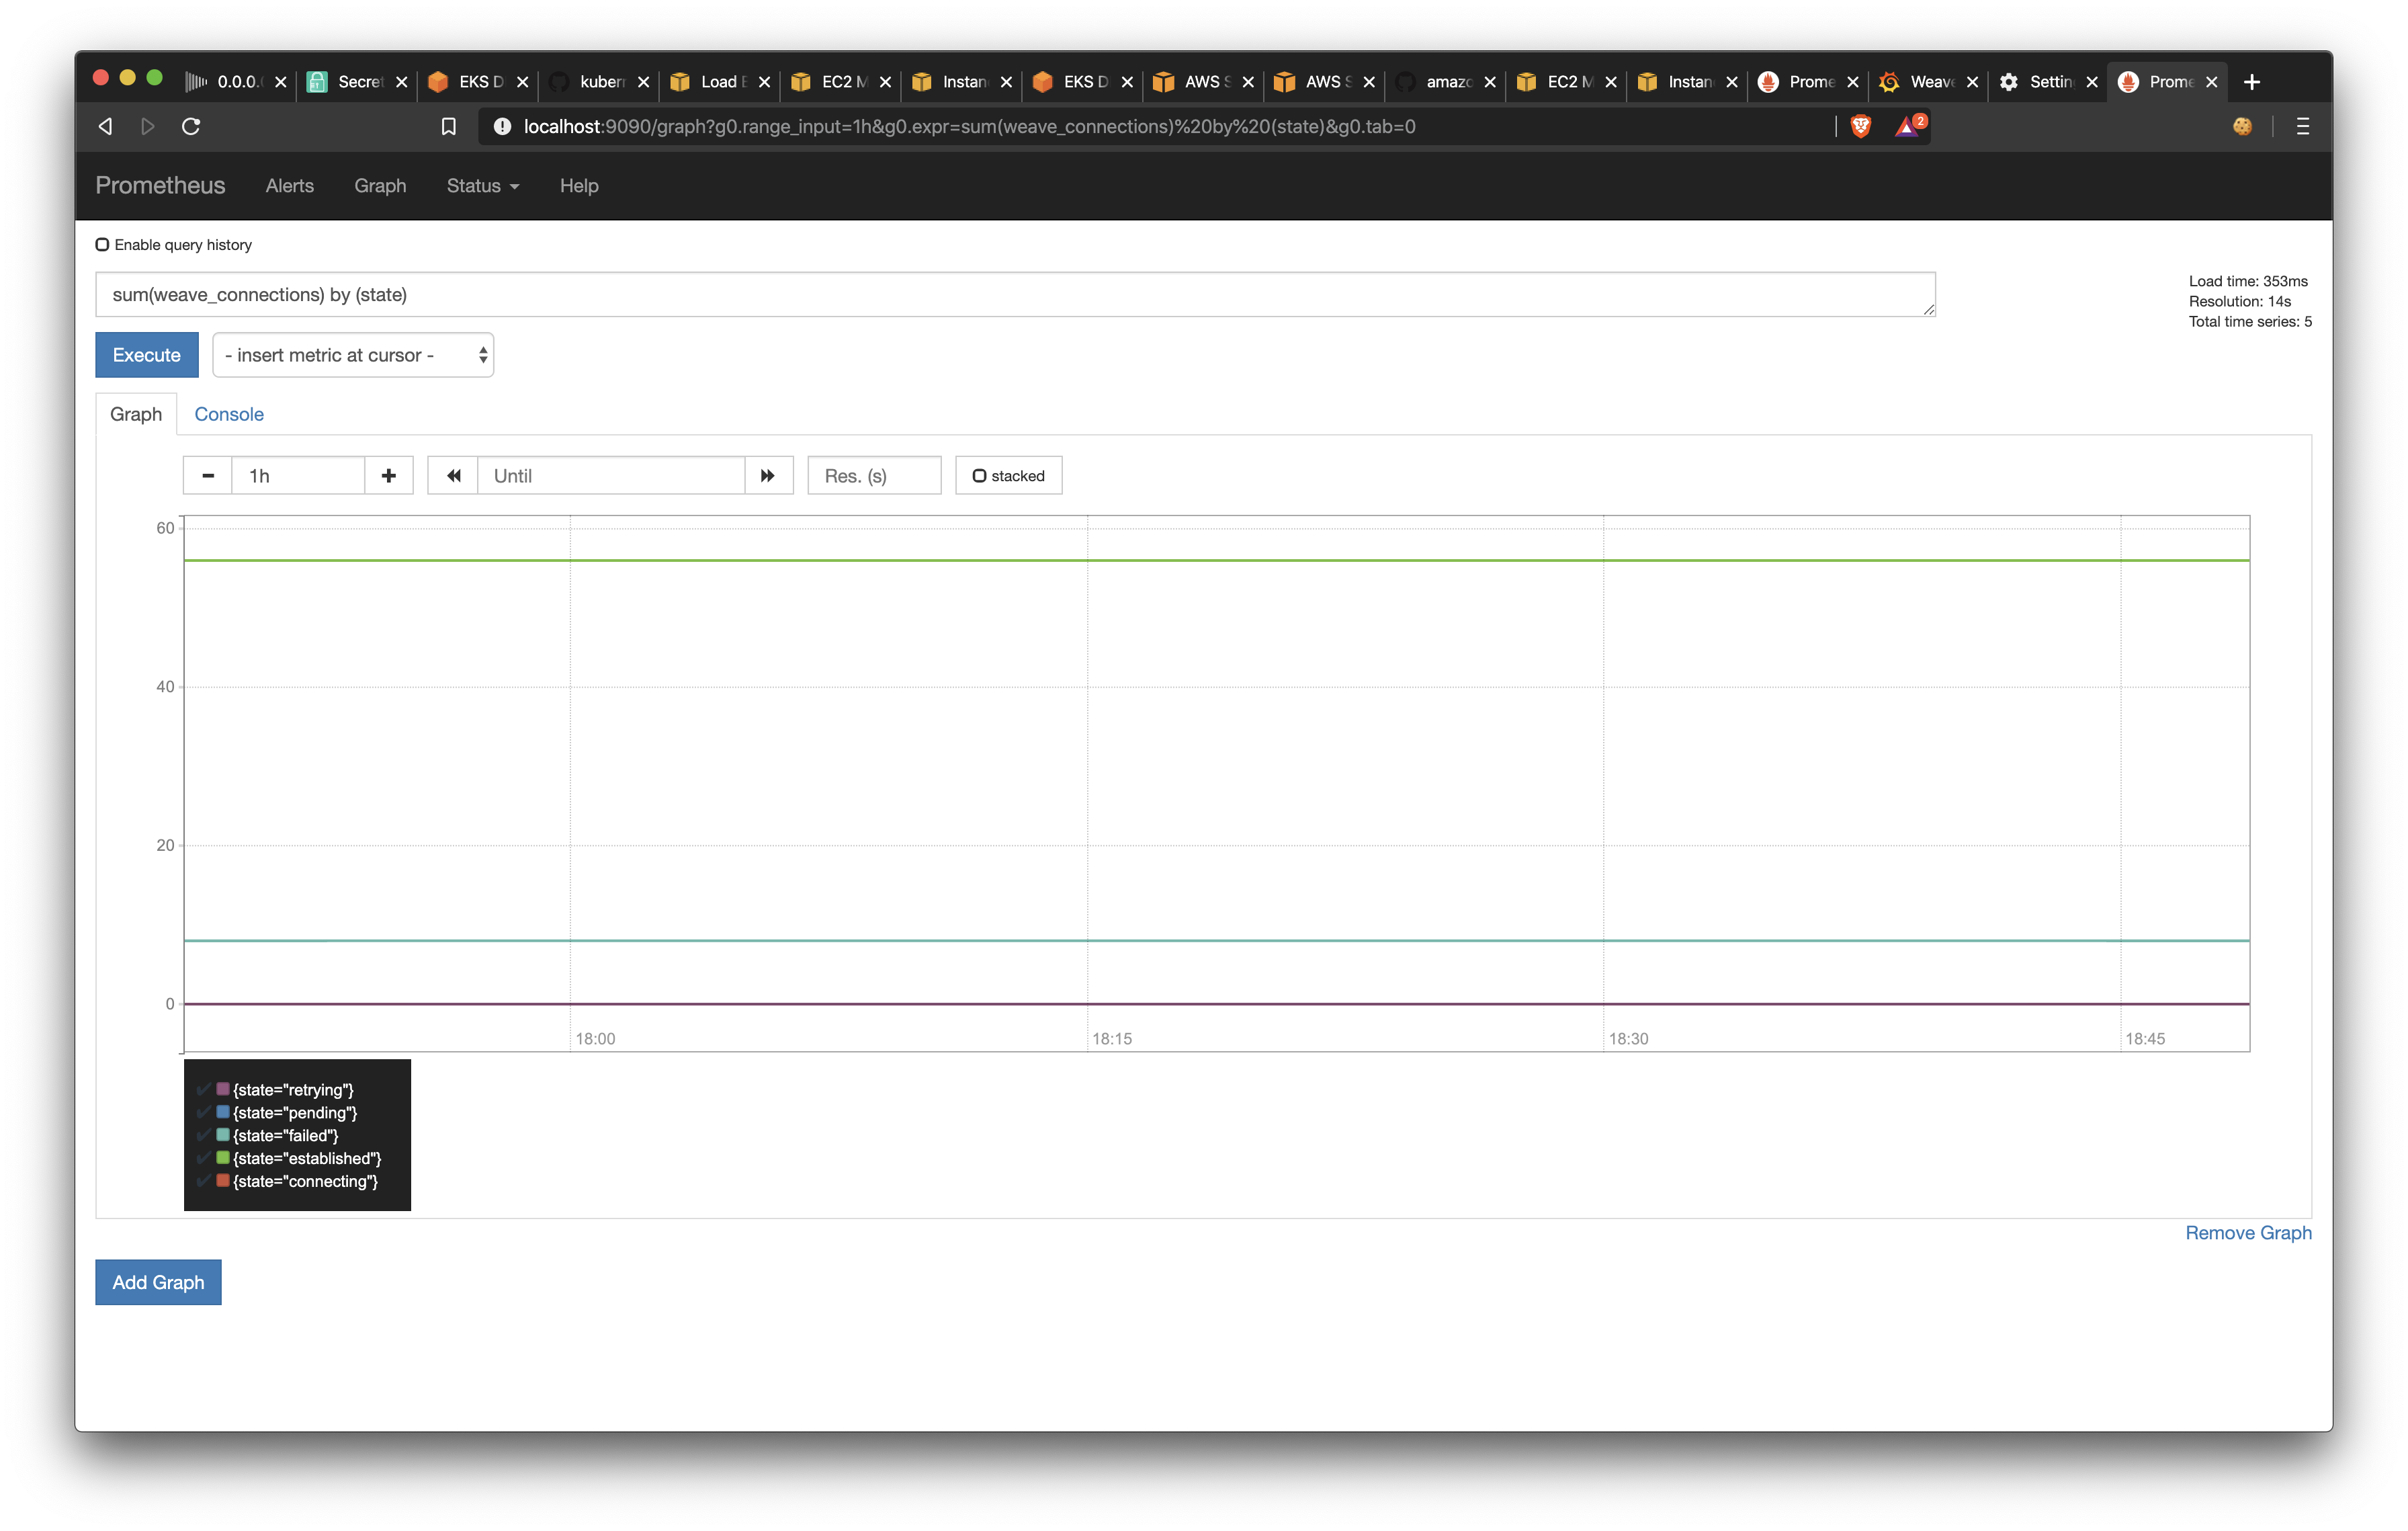
🤩 🤩
4. Installing Grafana Dashbaord
Several weave dashboards are available out there, I choose this one
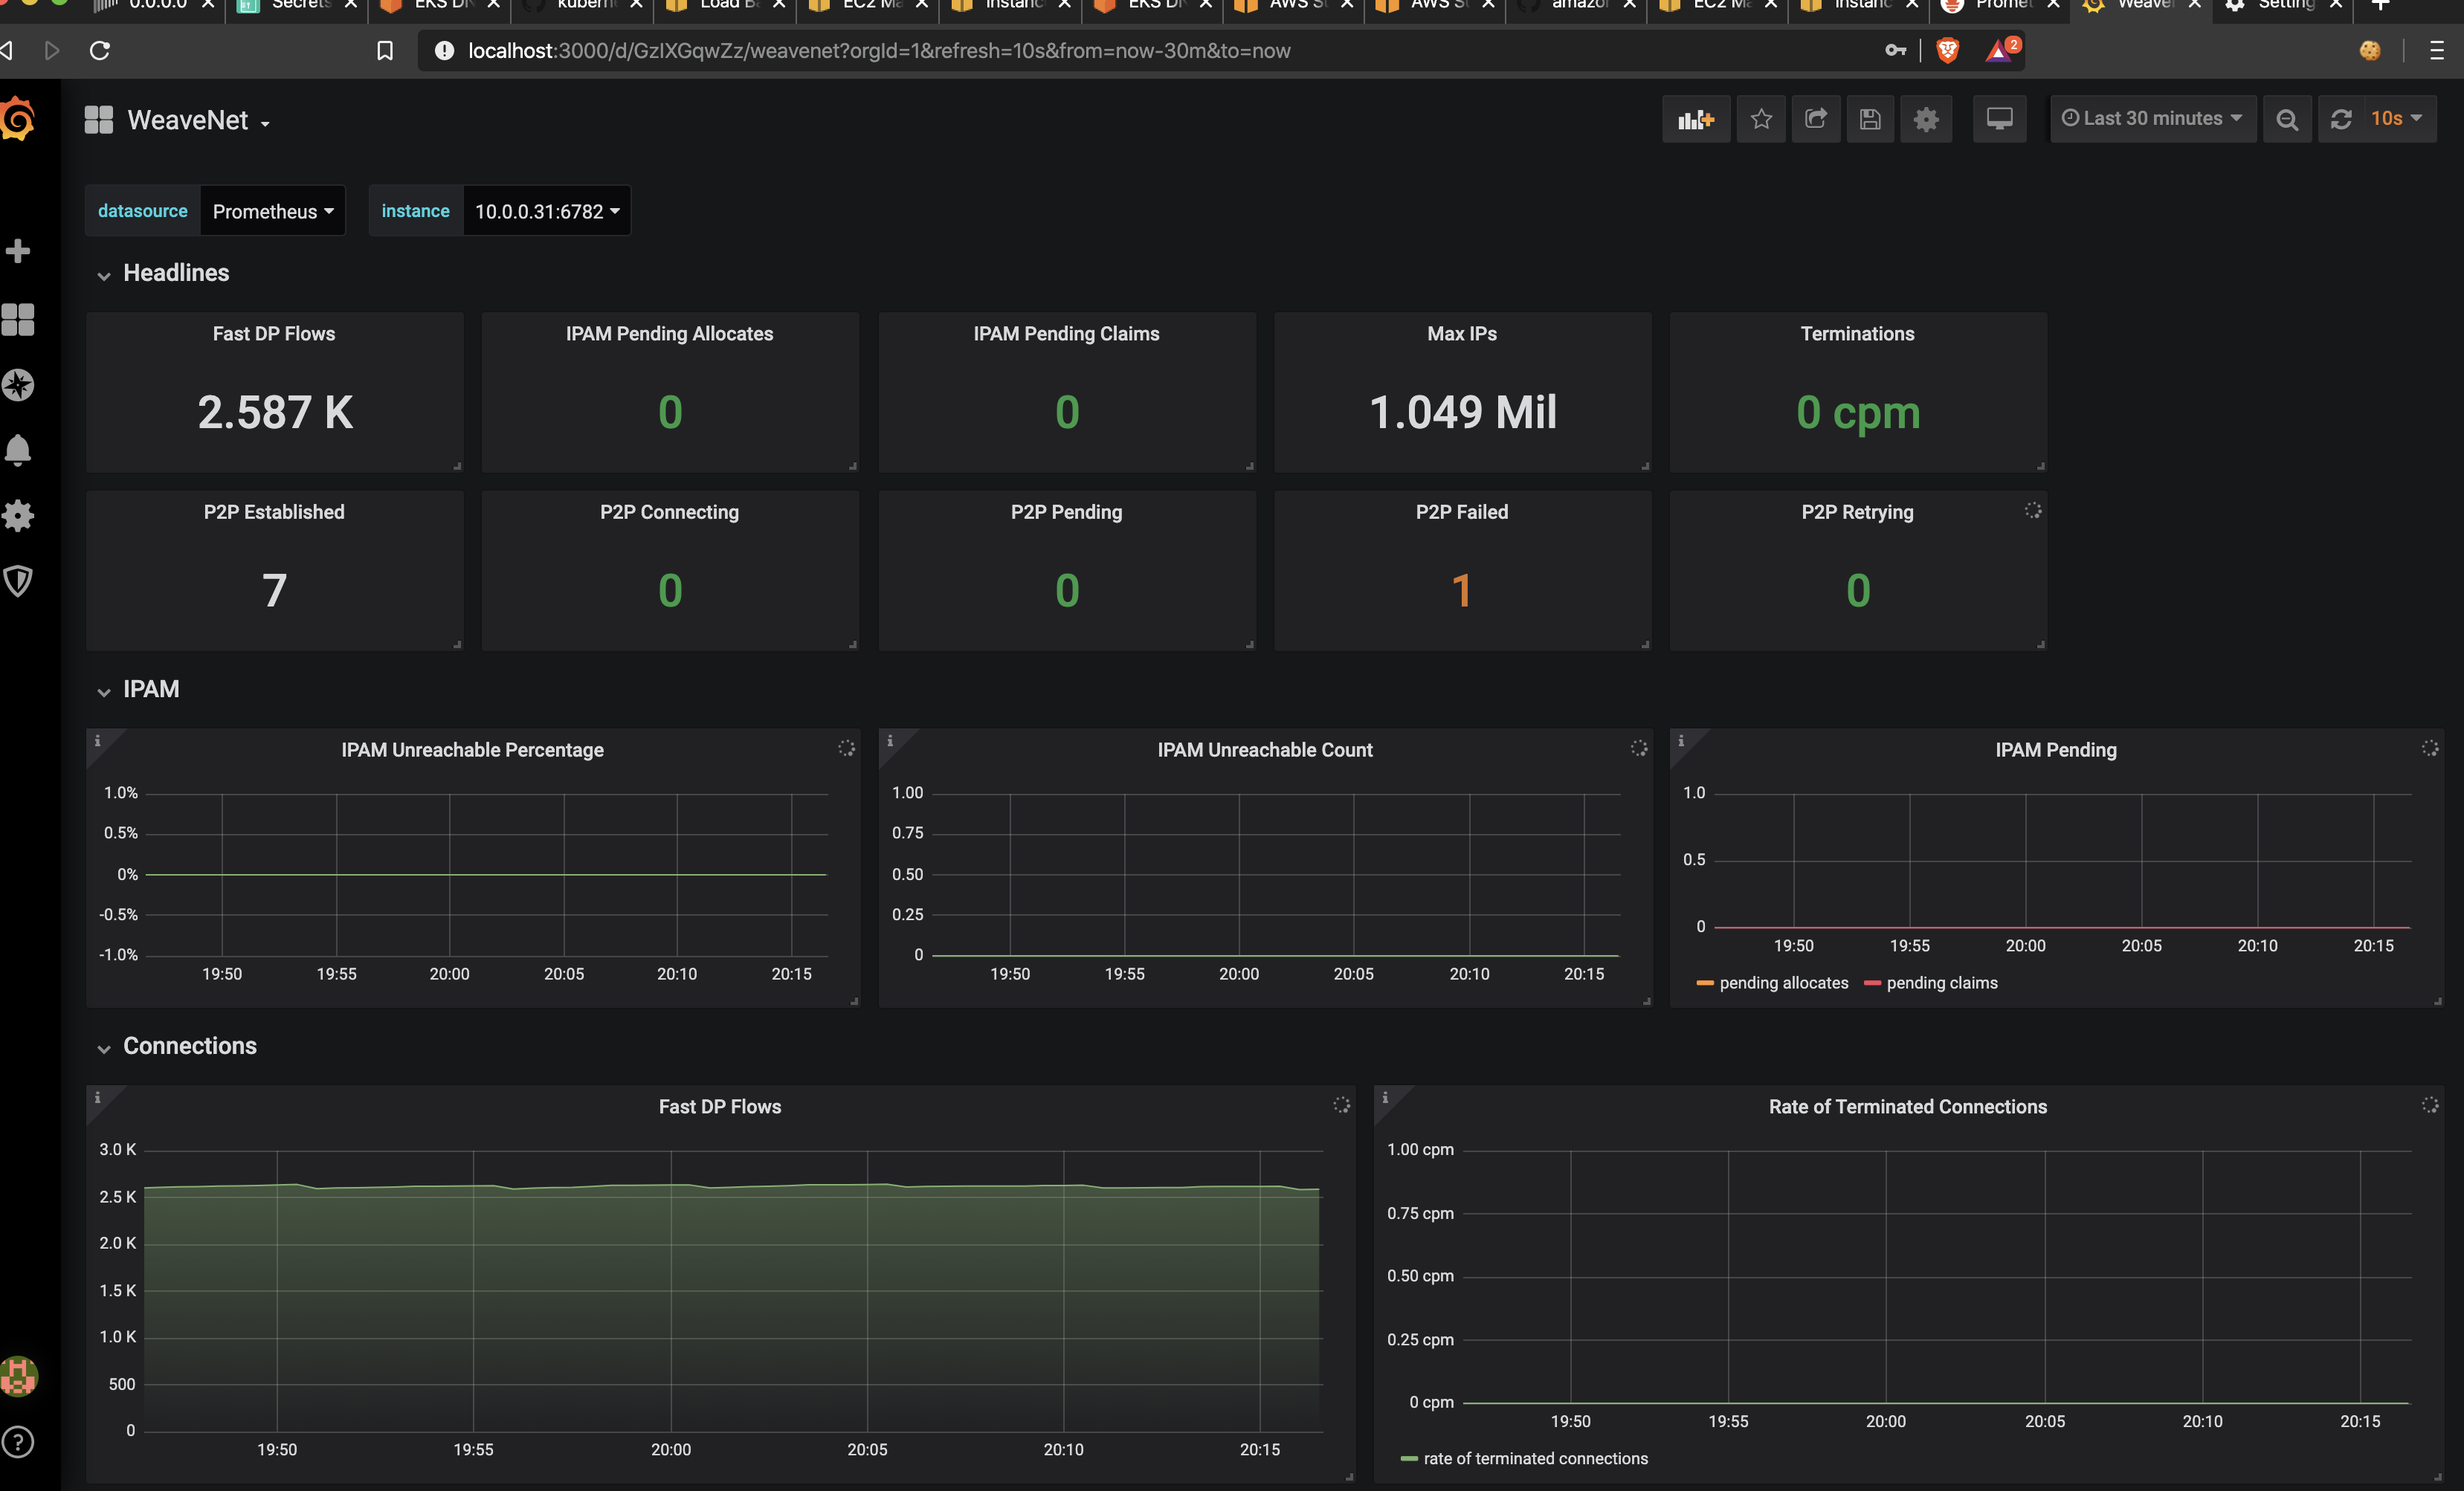
import it to Grafana and customize it to your needs.
5. Creating weave alert rules:
You should add alerts so you will get notified when something goes wrong. For example, I created an alert that will be fired in case weave_connections{state="pending"} goes beyond 0 for 5 minutes. my alert panel code
Once you have alert rules configured, your weave CNI is well monitored.